Foundation Models profiling with Xcode Instruments

Sponsored
Sponsor This Blog
Connect with a targeted audience of iOS developers and Swift engineers. Promote your developer tools, courses, or services.
Learn More →With iOS 26, Apple introduced the Foundation Models framework, making it easier to experiment with generative AI directly in your apps. While the transcript property lets you review the output of a session, it doesn't show how long the model needed to generate a response. To address this, Xcode 26 now includes a dedicated instrument for profiling Foundation Models. In this post, I'll walk you through how to use it to measure and optimize the performance of your model sessions.
Preparation
To get started, let's create a simple session and generate a haiku about Swift. This example will serve as a baseline for measuring performance in Xcode Instruments:
import SwiftUI
import FoundationModels

struct ContentView: View {
    private let session = LanguageModelSession {
        "You're a haiku generator."
    }

    private let prompt = Prompt {
        "Generate a haiku about Swift"
    }

    @State private var text = ""

    var body: some View {
        VStack {
            Text(text)
            Button("Generate") {
                Task {
                    do {
                        let response = try await session.respond(to: prompt)
                        text = response.content
                    } catch {
                        print(error)
                    }
                }
            }
        }
        .padding()
    }
}
To run Instruments profiling in Xcode:
- Go to Product → Profile.
- In the Instruments window, choose the Blank template.
- Add a new instrument with + Instrument and select Foundation Models.
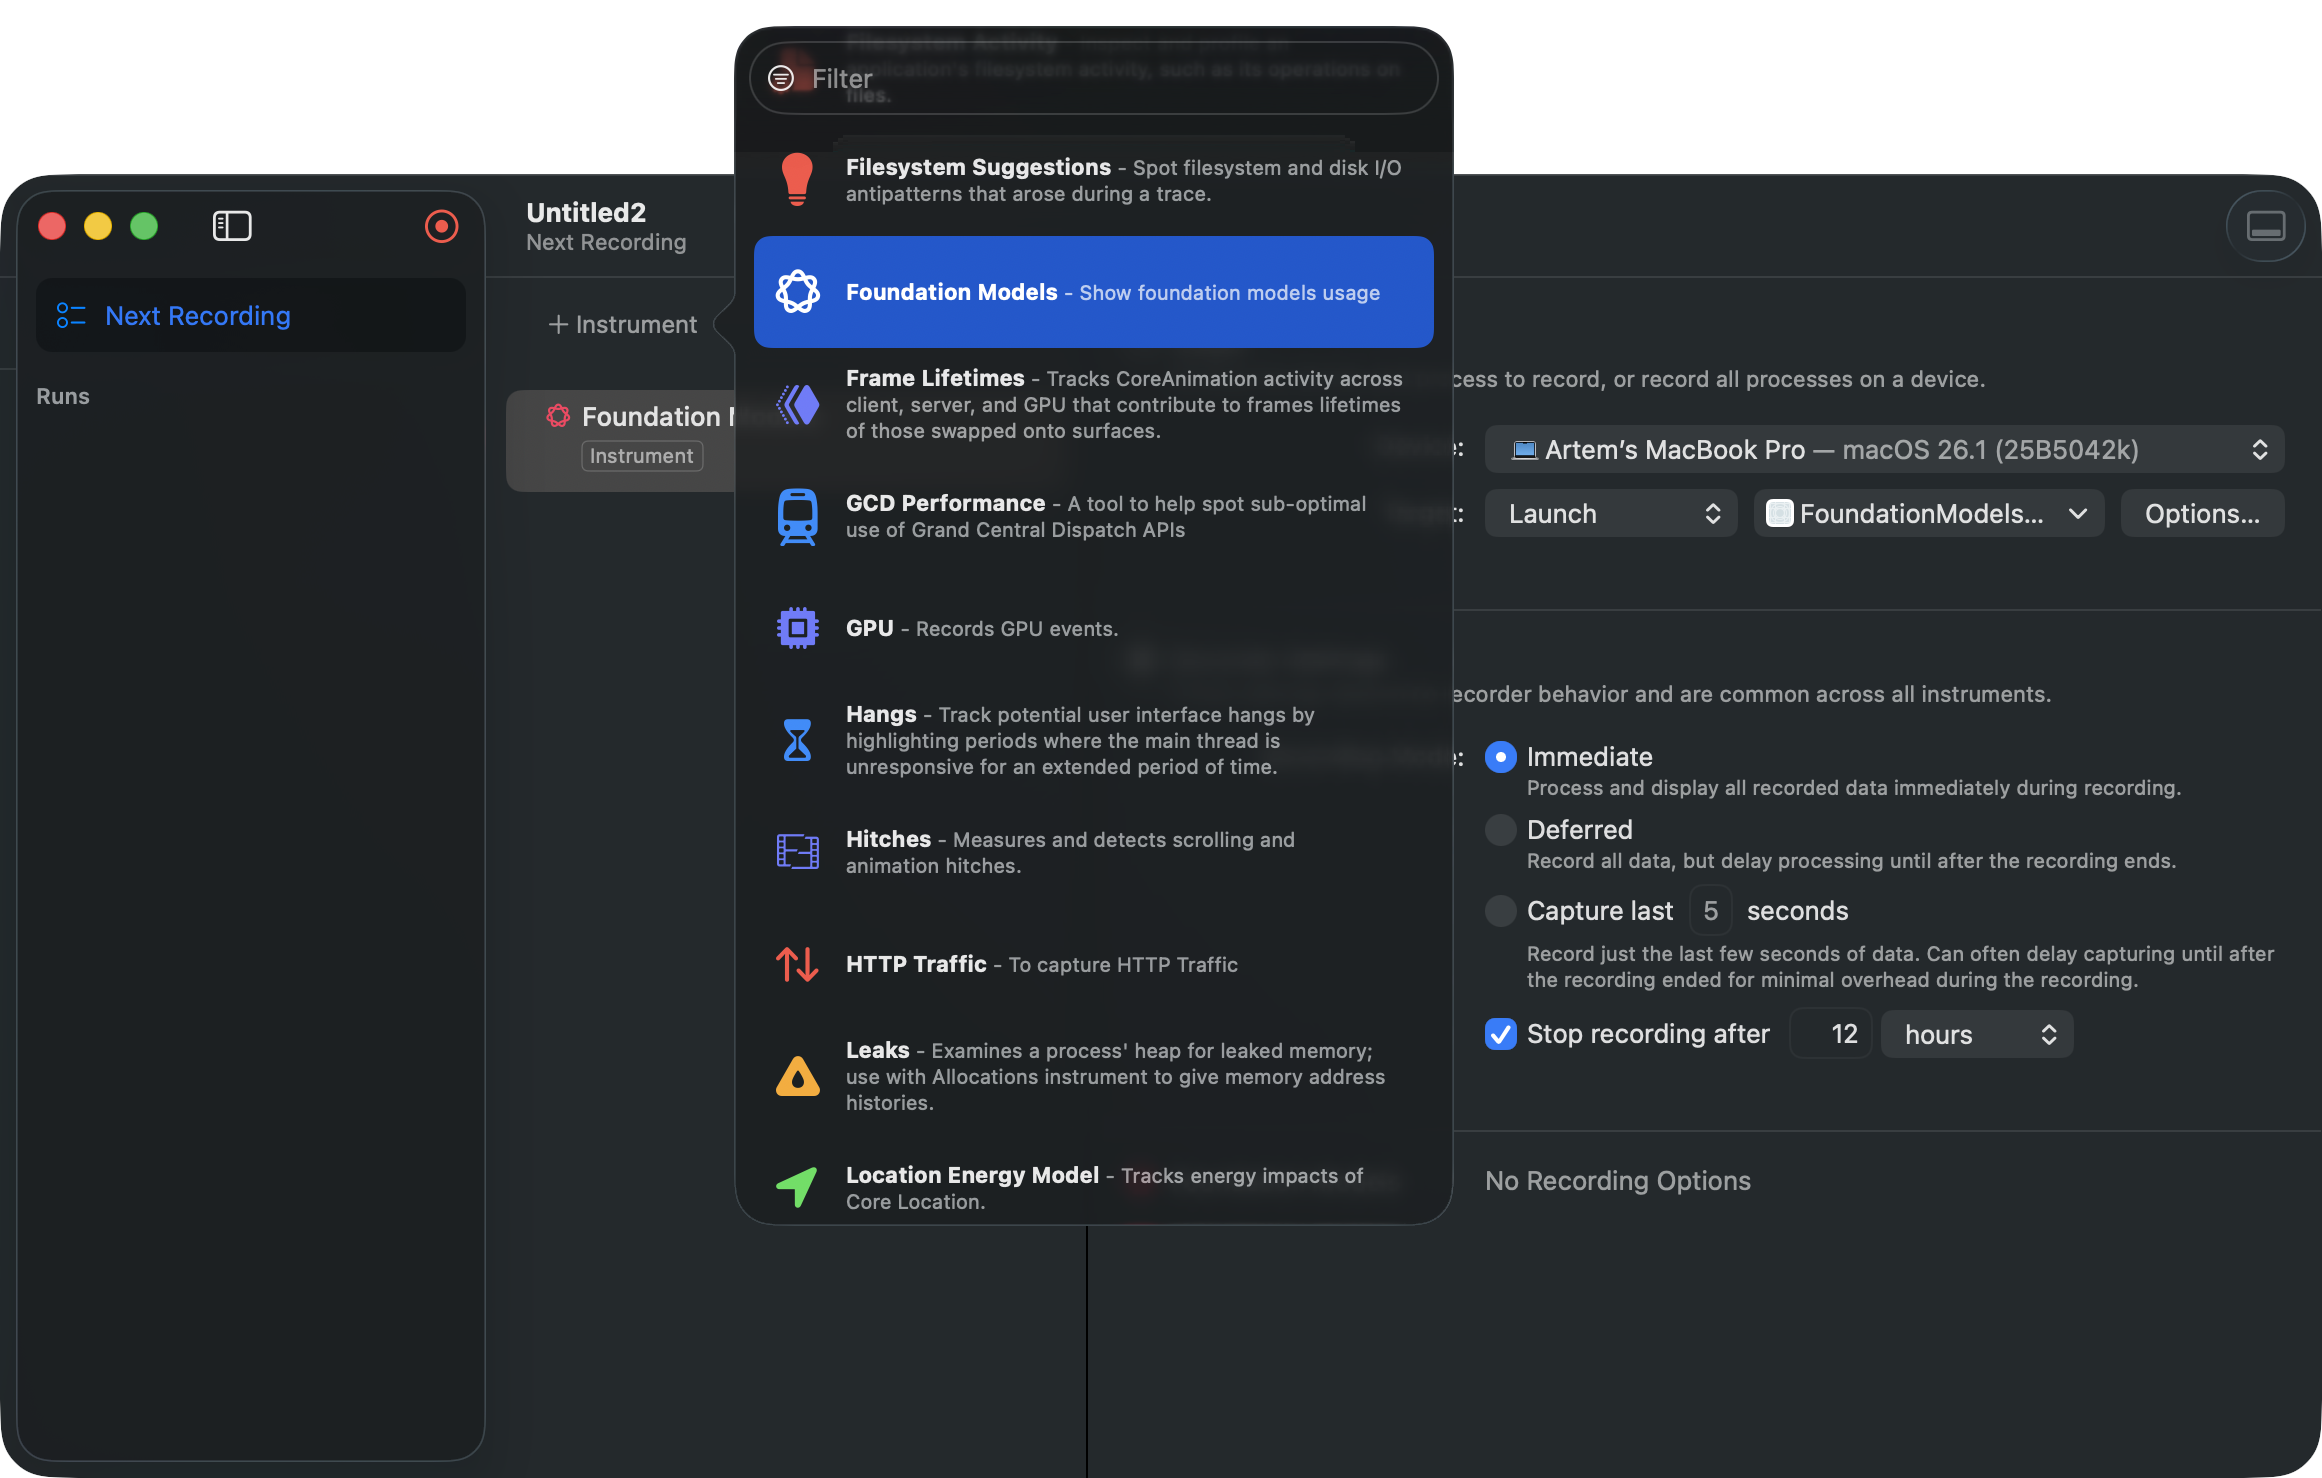
You can reuse my Foundation Models template to profile the sessions.
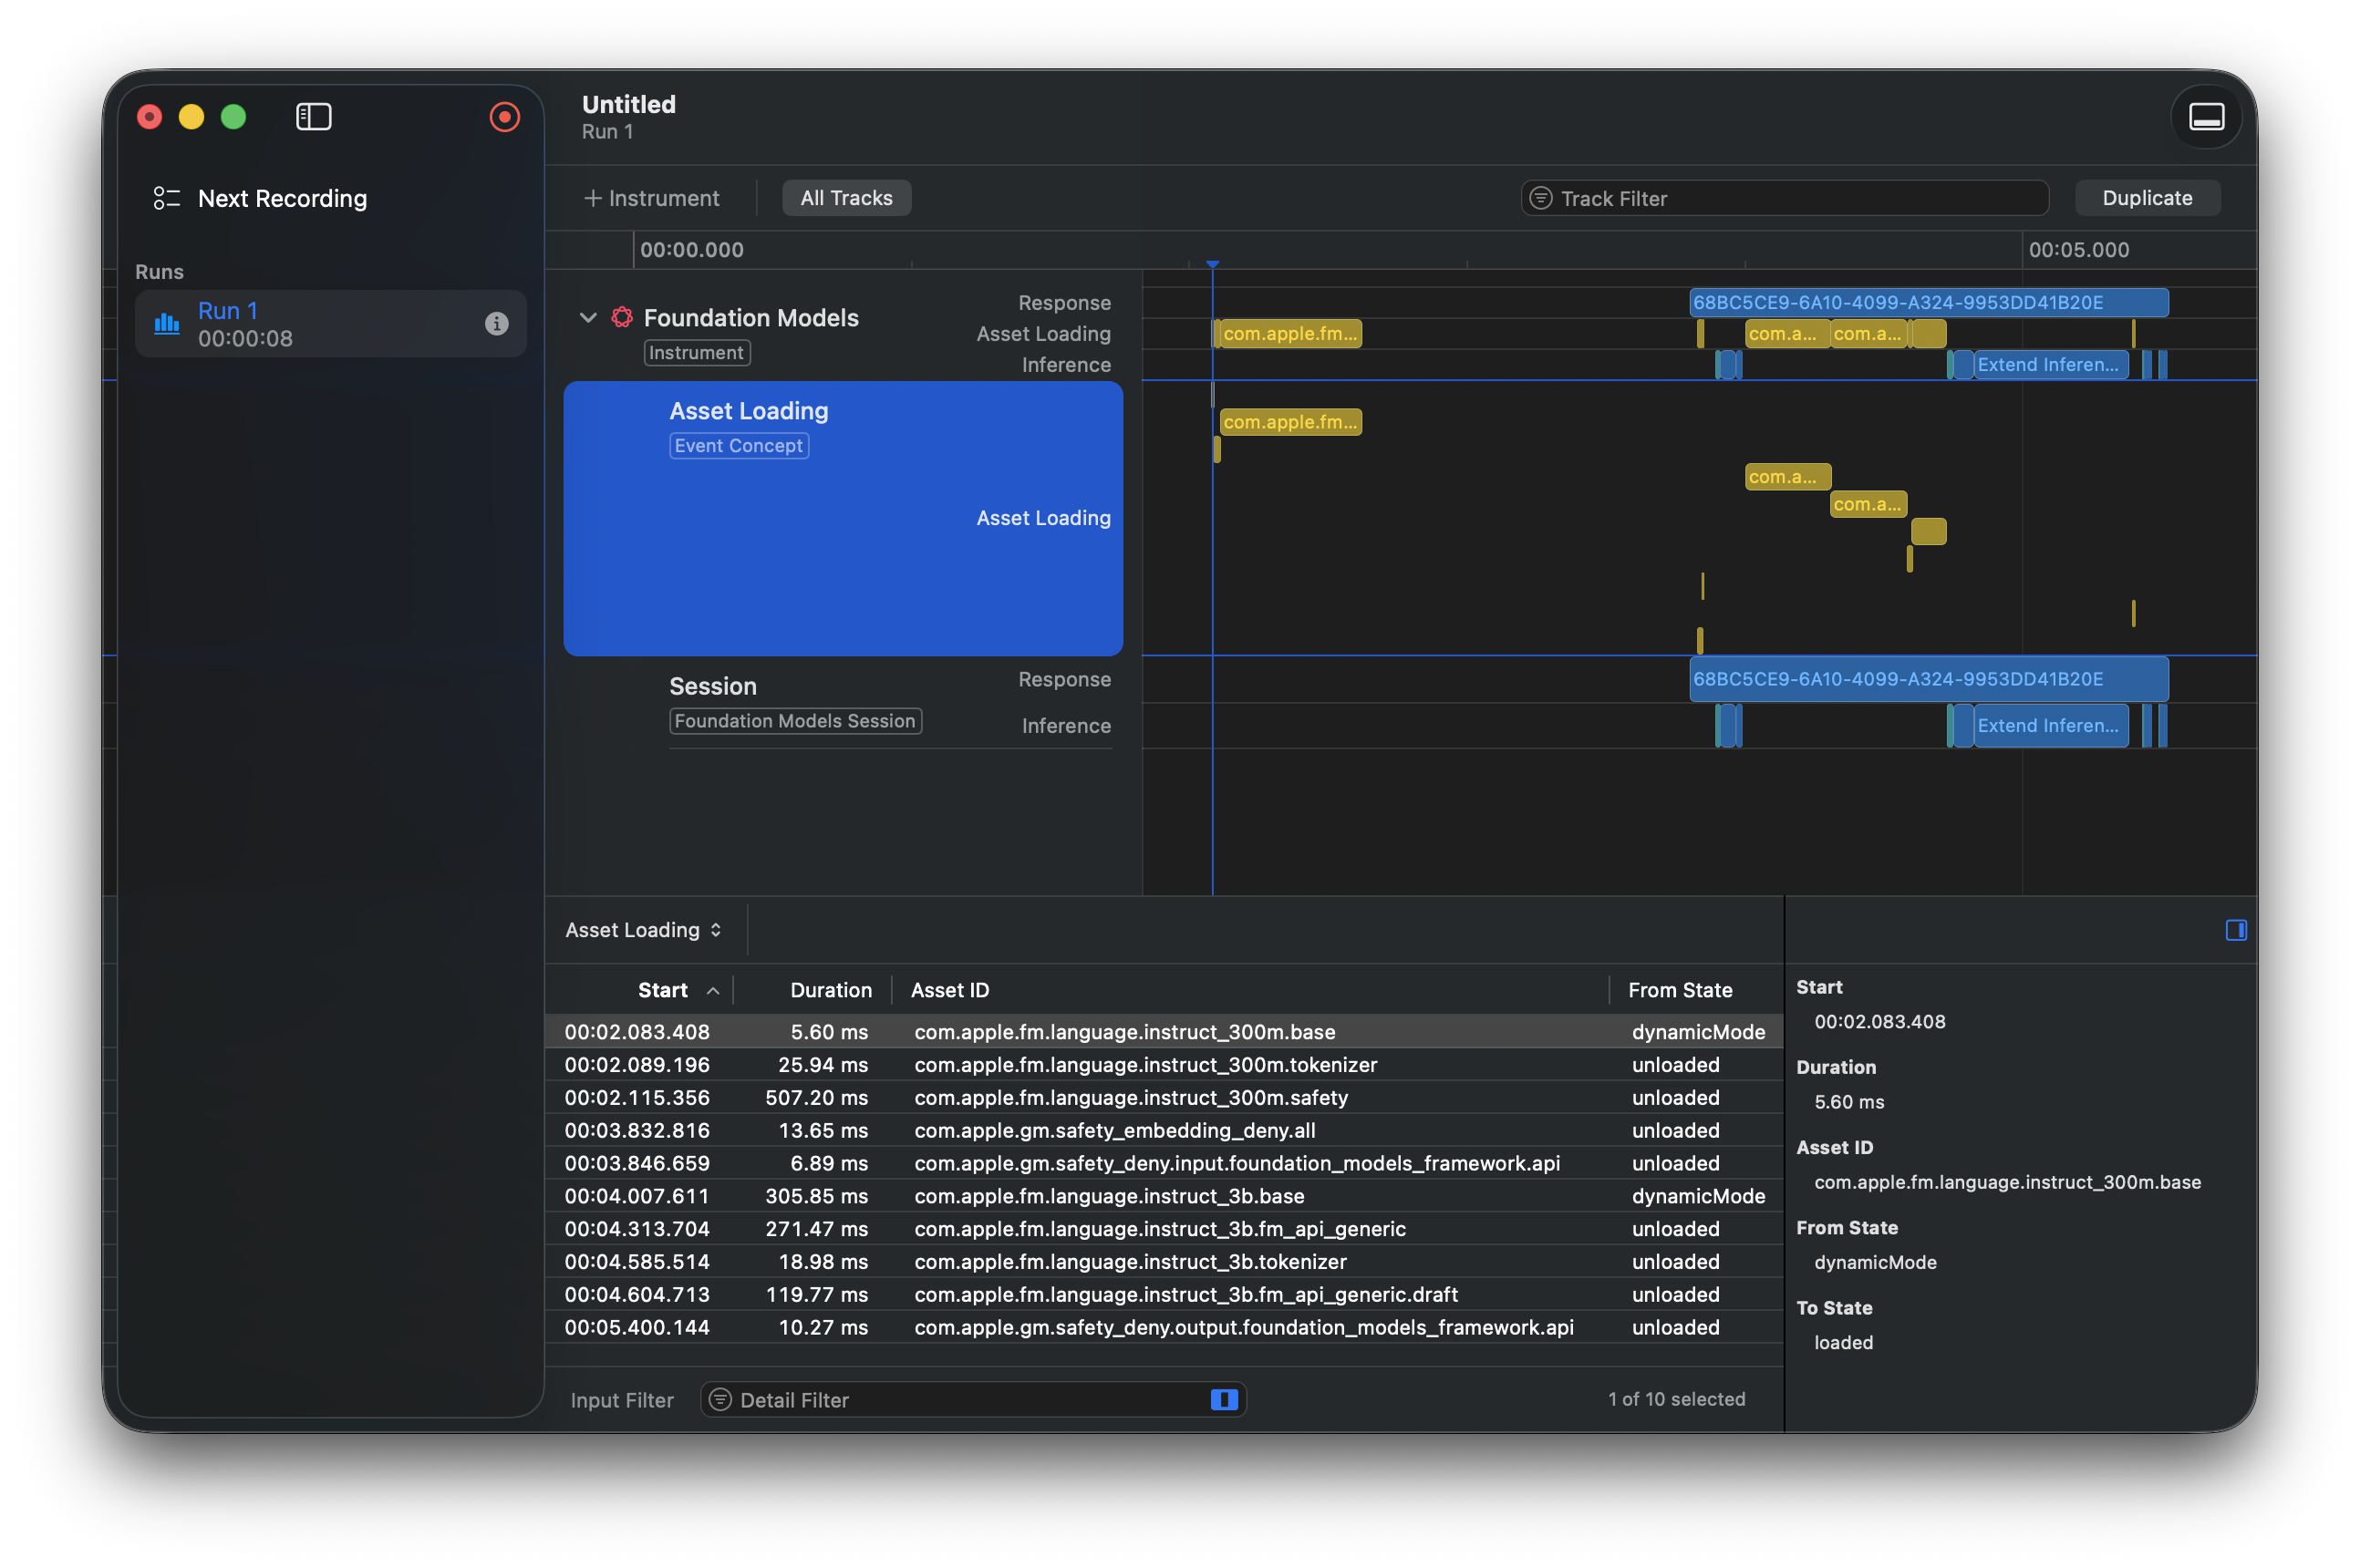
Press Record, and the app will launch. Then tap Generate to produce a haiku. In the profiling results, the first section displays the asset loading time:
The second section shows the session information:
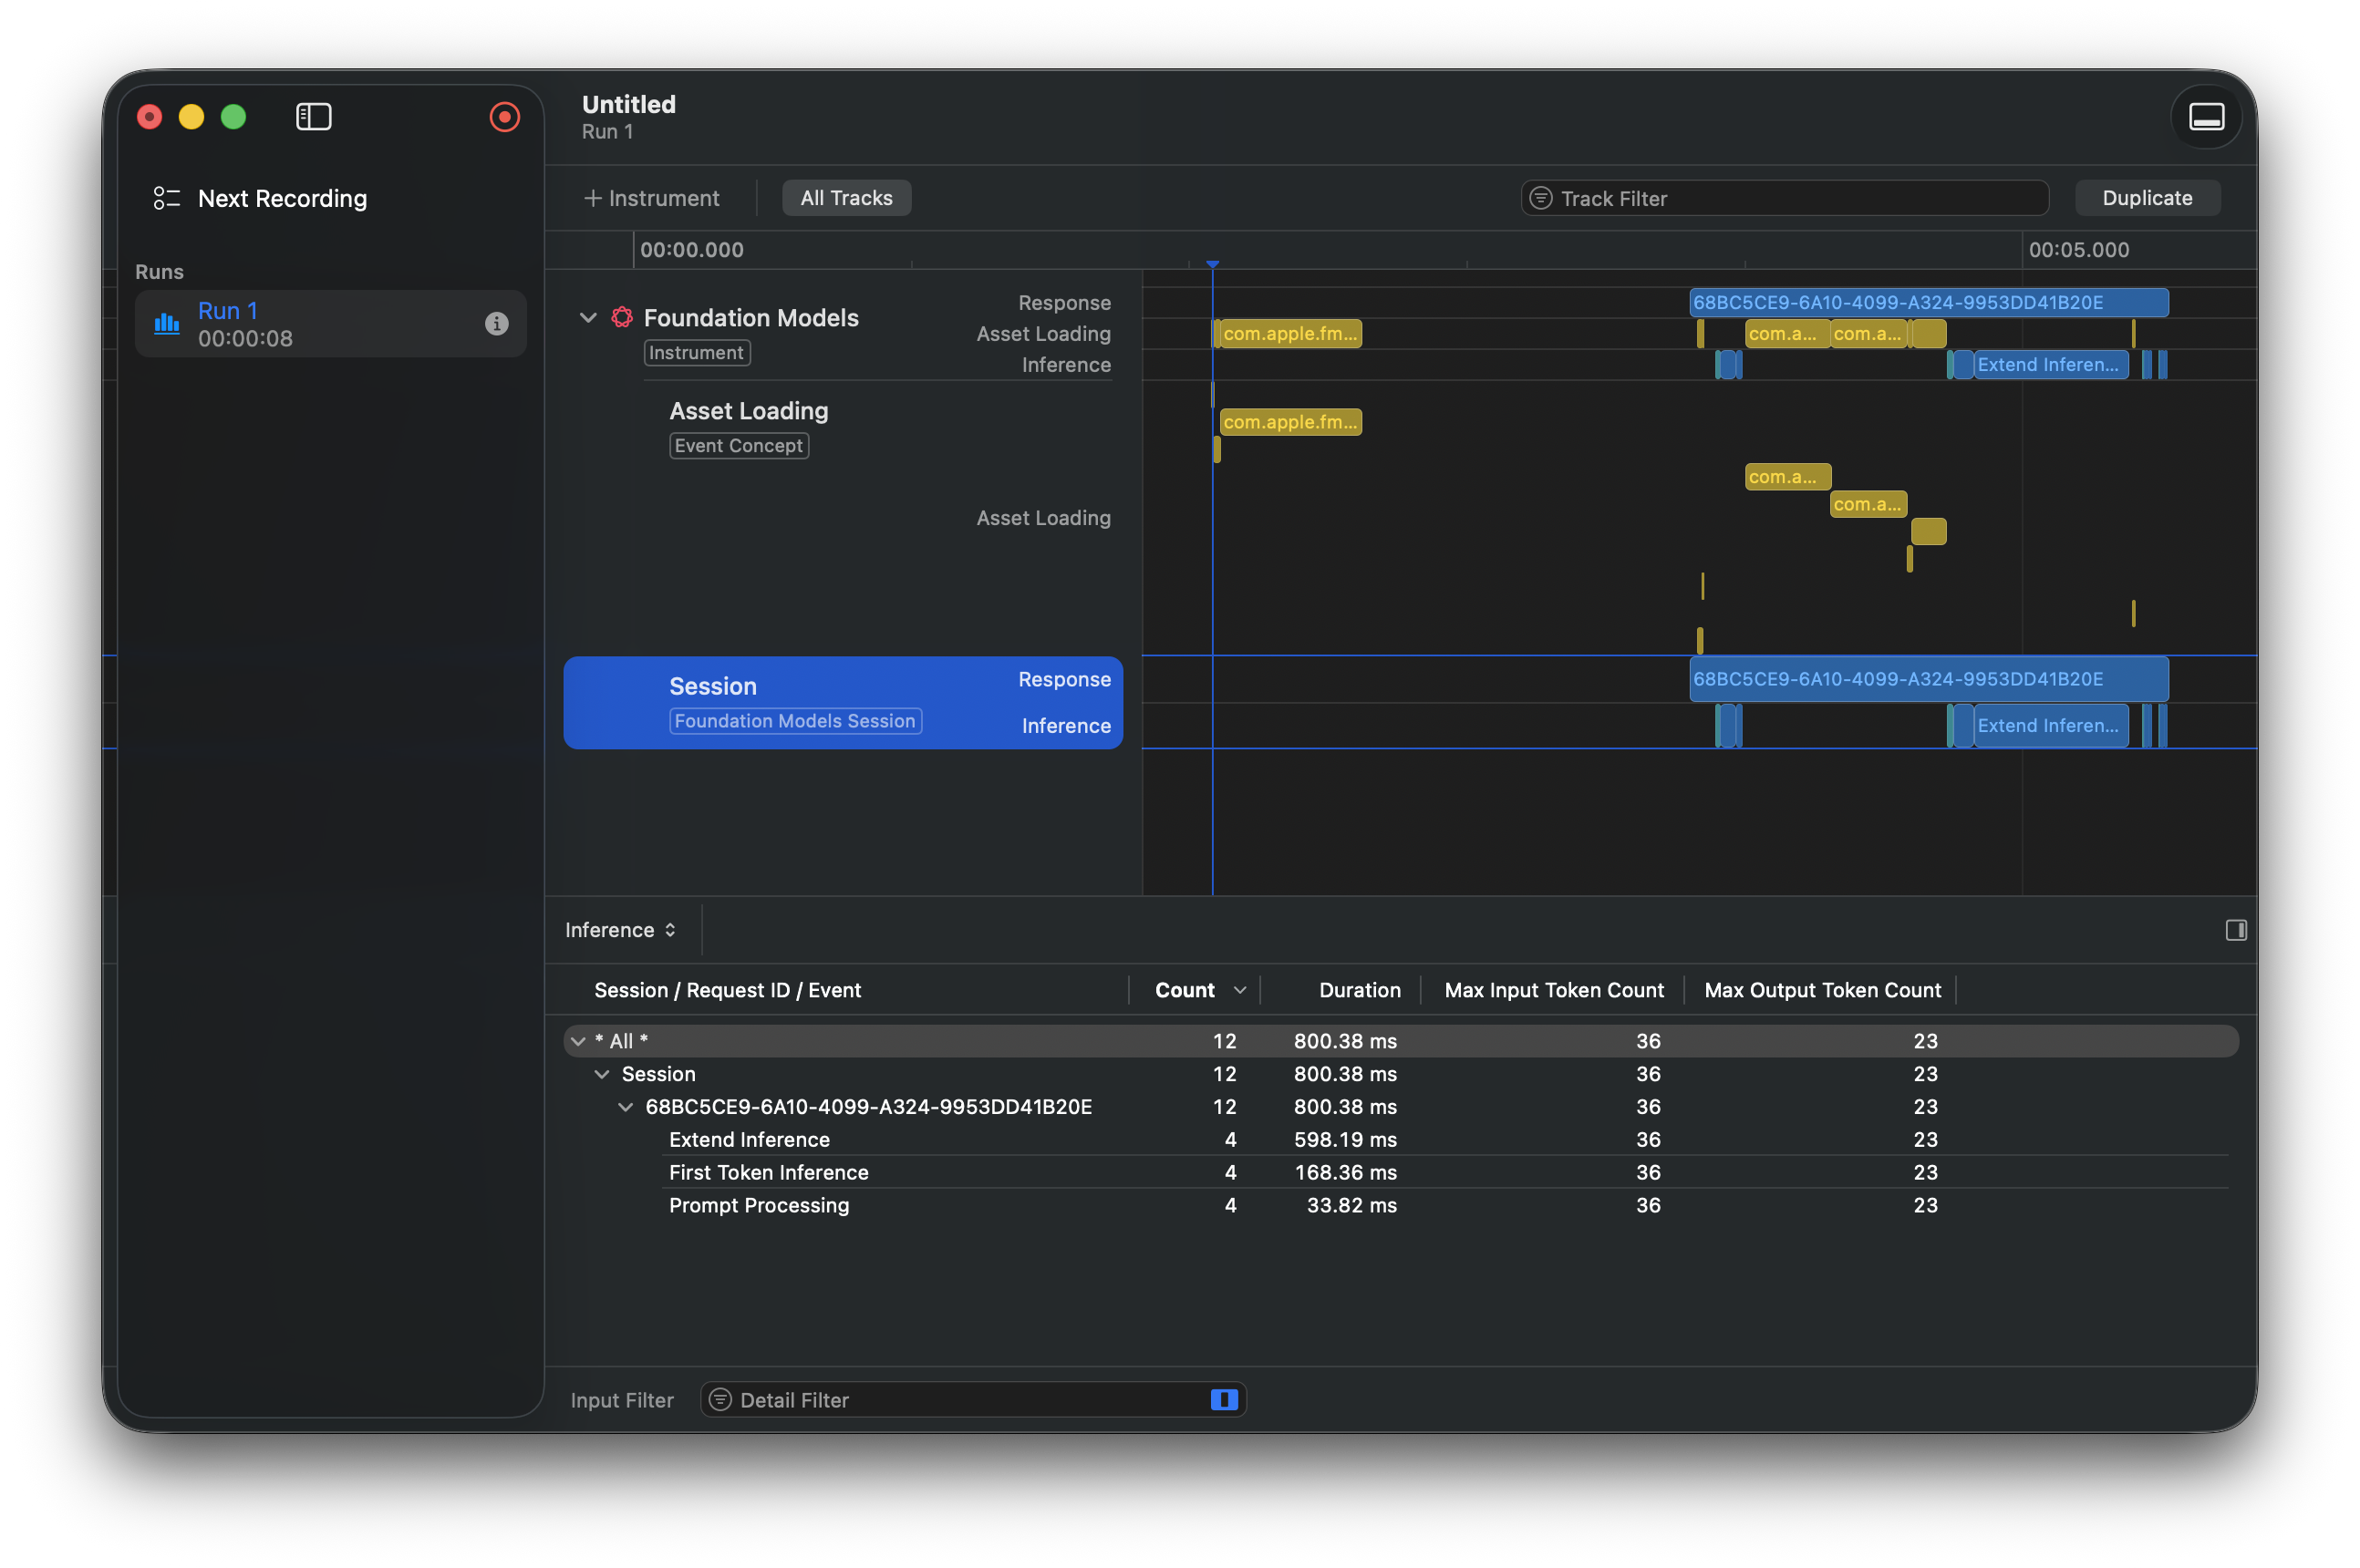
Here we can see total response time, prompt processing, etc. You can also view the input and output token counts. Tracking these is critical, since exceeding the token limit can cause failures. The system model supports up to 4,096 tokens.
Let's update the session and add tool calling.
Tool calling
Create a tool to generate a random mood:
import FoundationModels

enum Mood: String, CaseIterable {
    case melancholic
    case joyful
    case mysterious
    case playful
}

struct MoodTool: Tool {
    let name = "generateRandomMood"
    let description = "Generate a random mood for haiku"
    @Generable
    struct Arguments {}

    func call(arguments: Arguments) async throws -> String? {
        Mood.allCases.randomElement()?.rawValue
    }
}
Add the tool to the session:
private let session = LanguageModelSession(tools: [MoodTool()]) {
    "You're a haiku generator."
}
Run profiling again and you'll see the tool calling time:
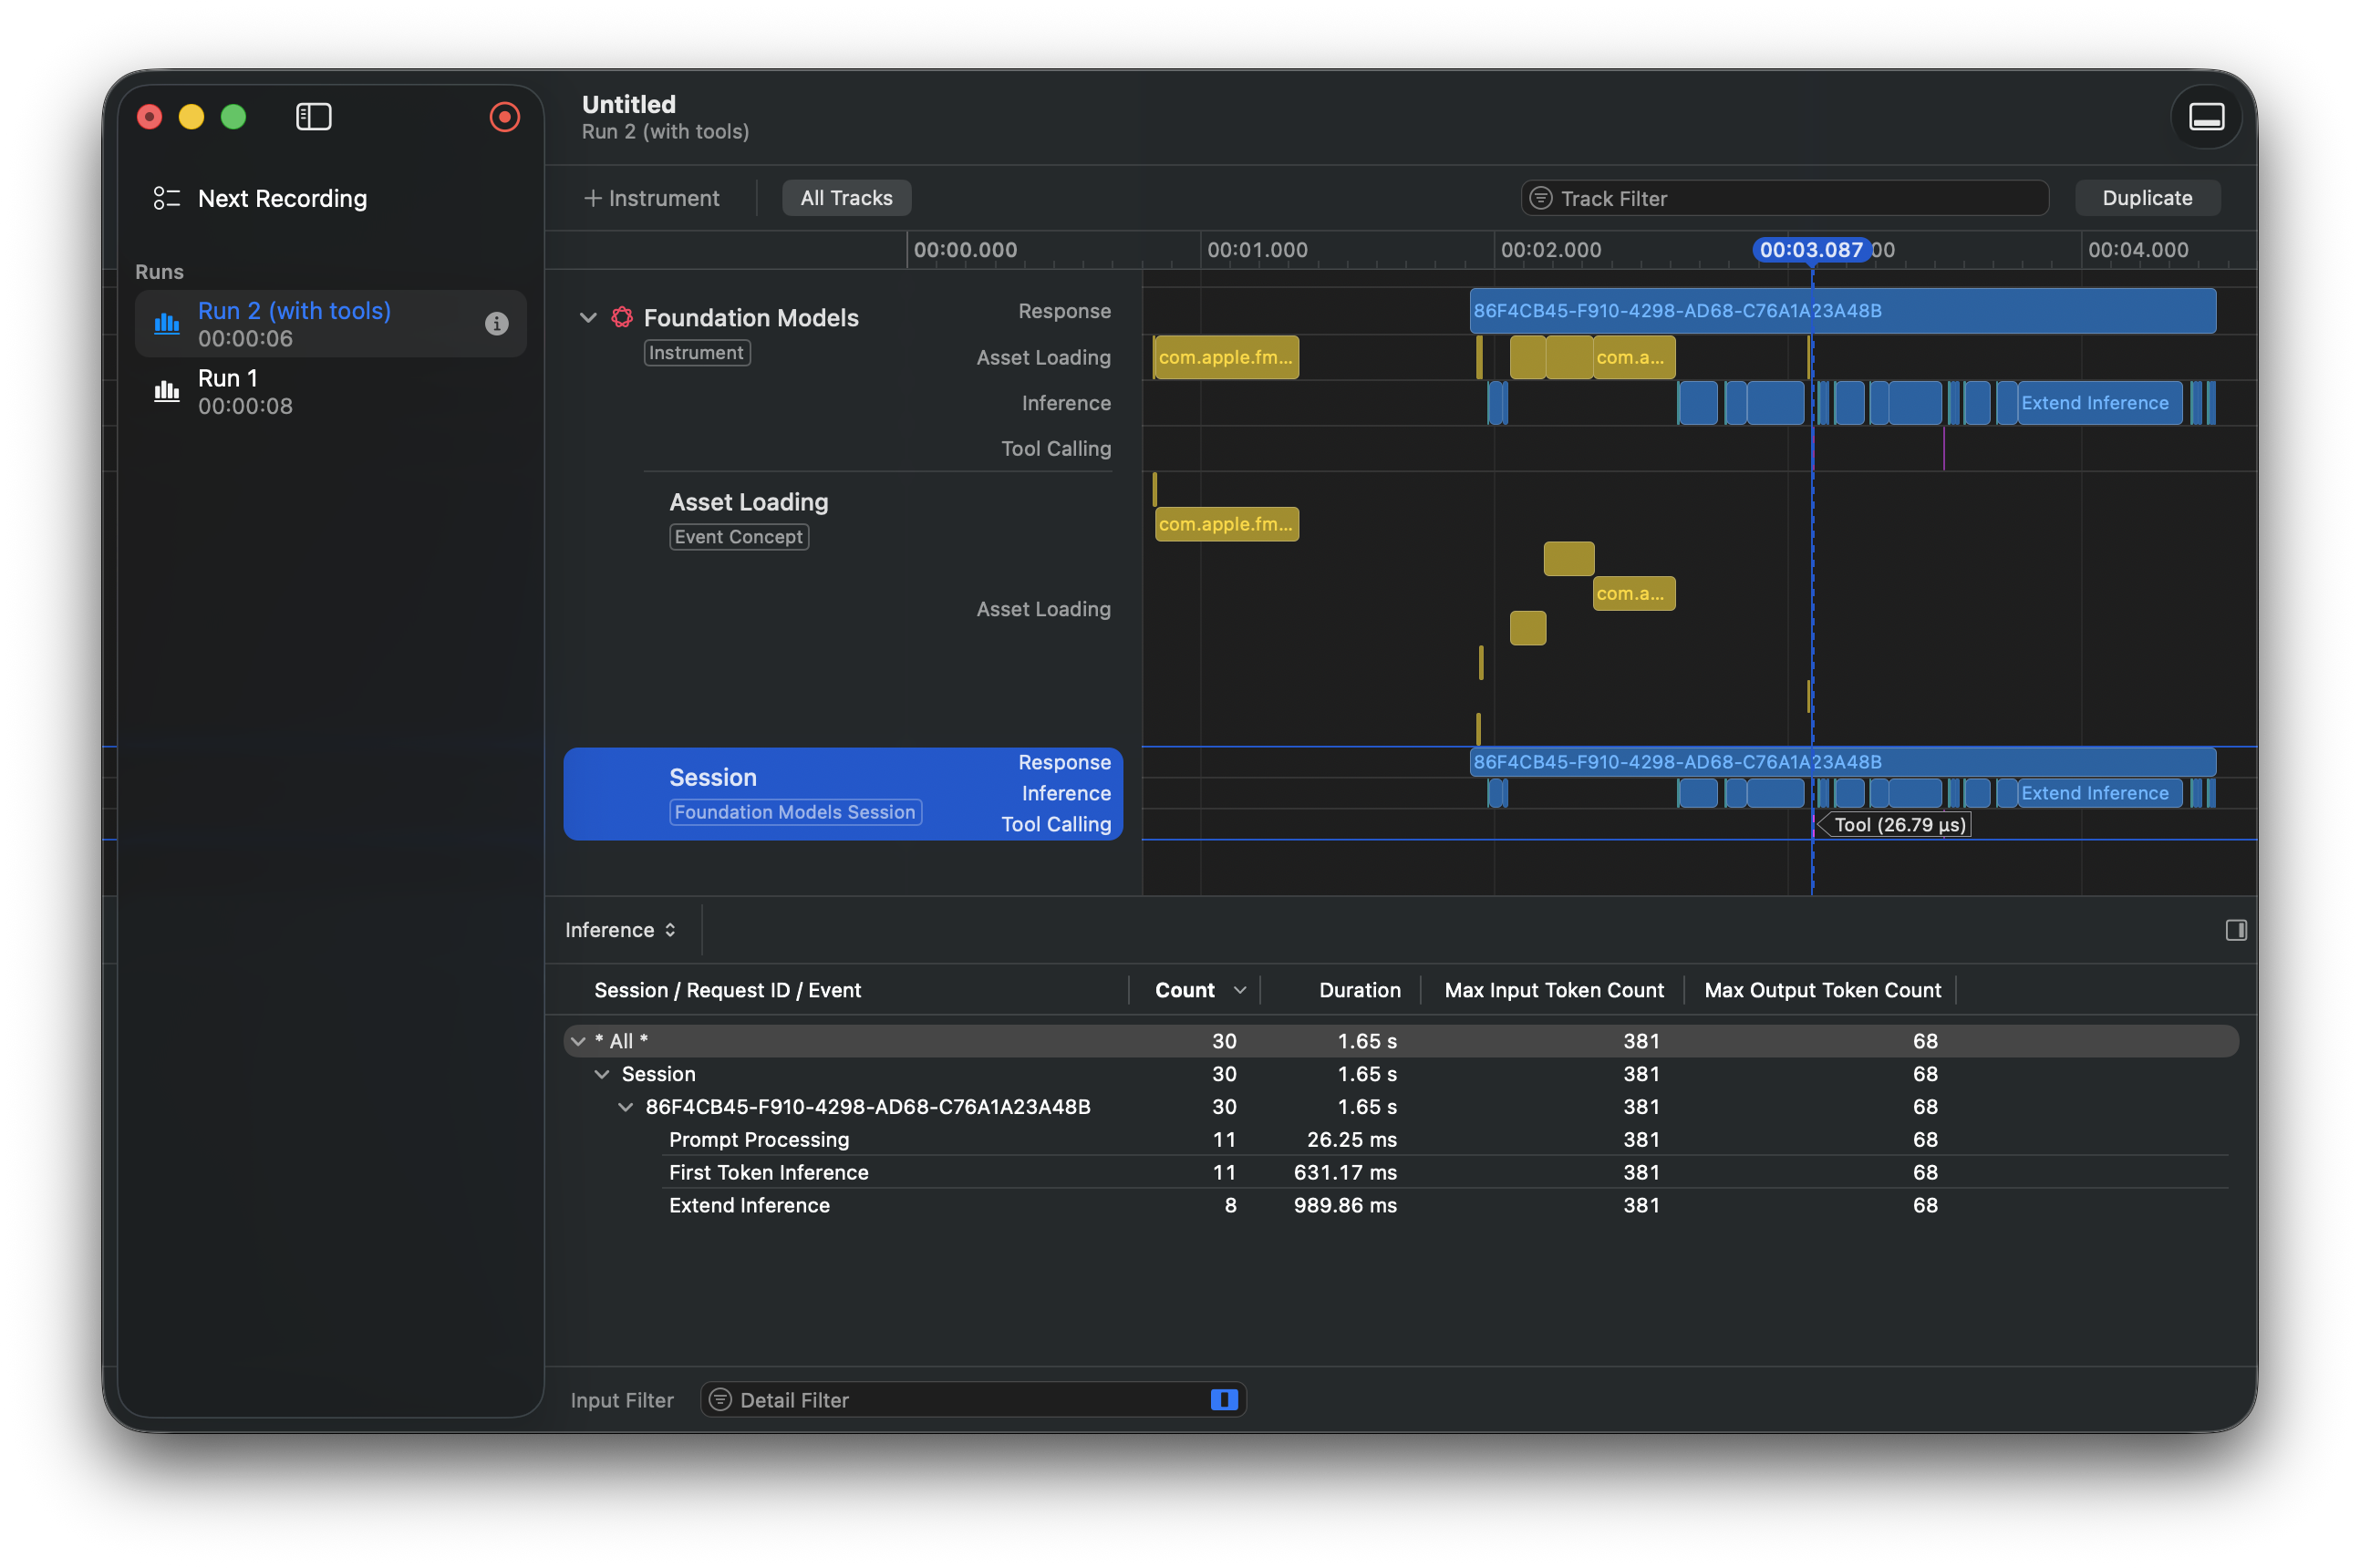
This view highlights tools with longer processing times. To improve performance, you can use techniques such as caching results. In our case, the tool was called twice, so adjusting the prompt could reduce it to a single call.
Another useful optimization is prewarming the session, which helps reduce response latency.
Prewarming the session
Next, add a prewarm function call:
.onAppear {
    session.prewarm()
}
We may notice that response time decreases:
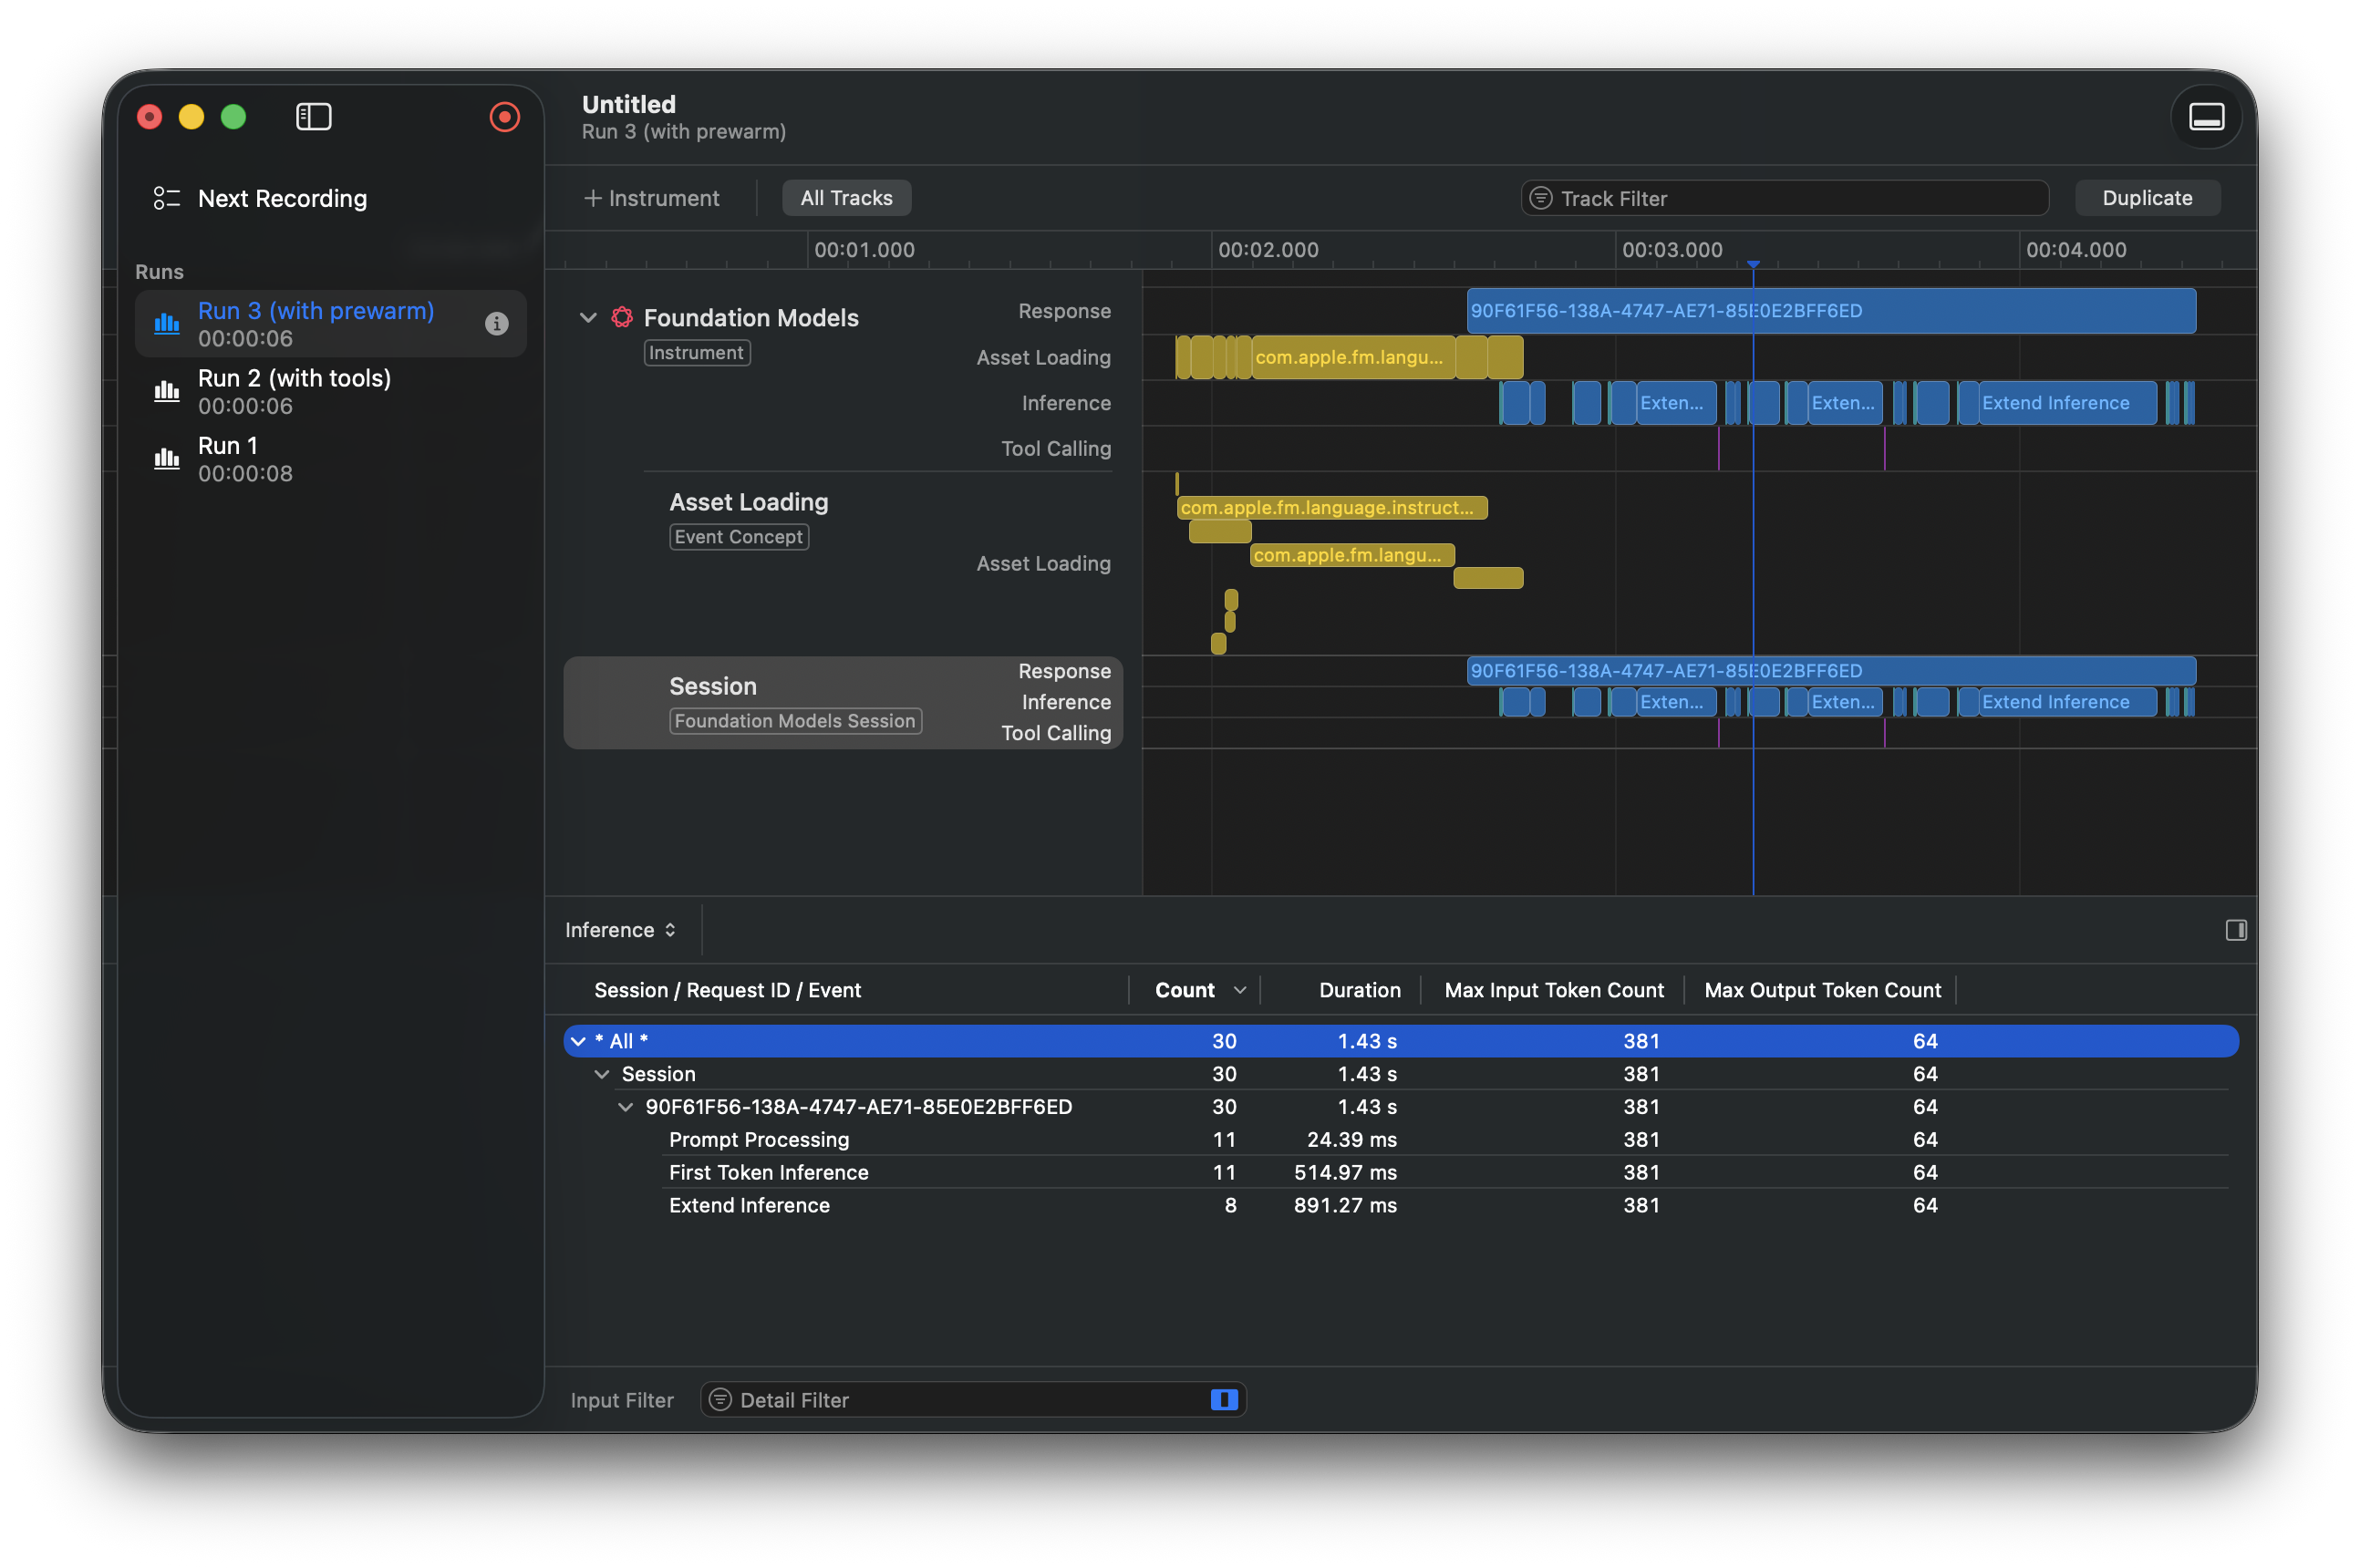
If you already know the prompt, you can pass it during prewarm. This allows the system to process it eagerly, reducing latency for future responses:
.onAppear {
    session.prewarm(promptPrefix: prompt)
}
The response time is even better now:
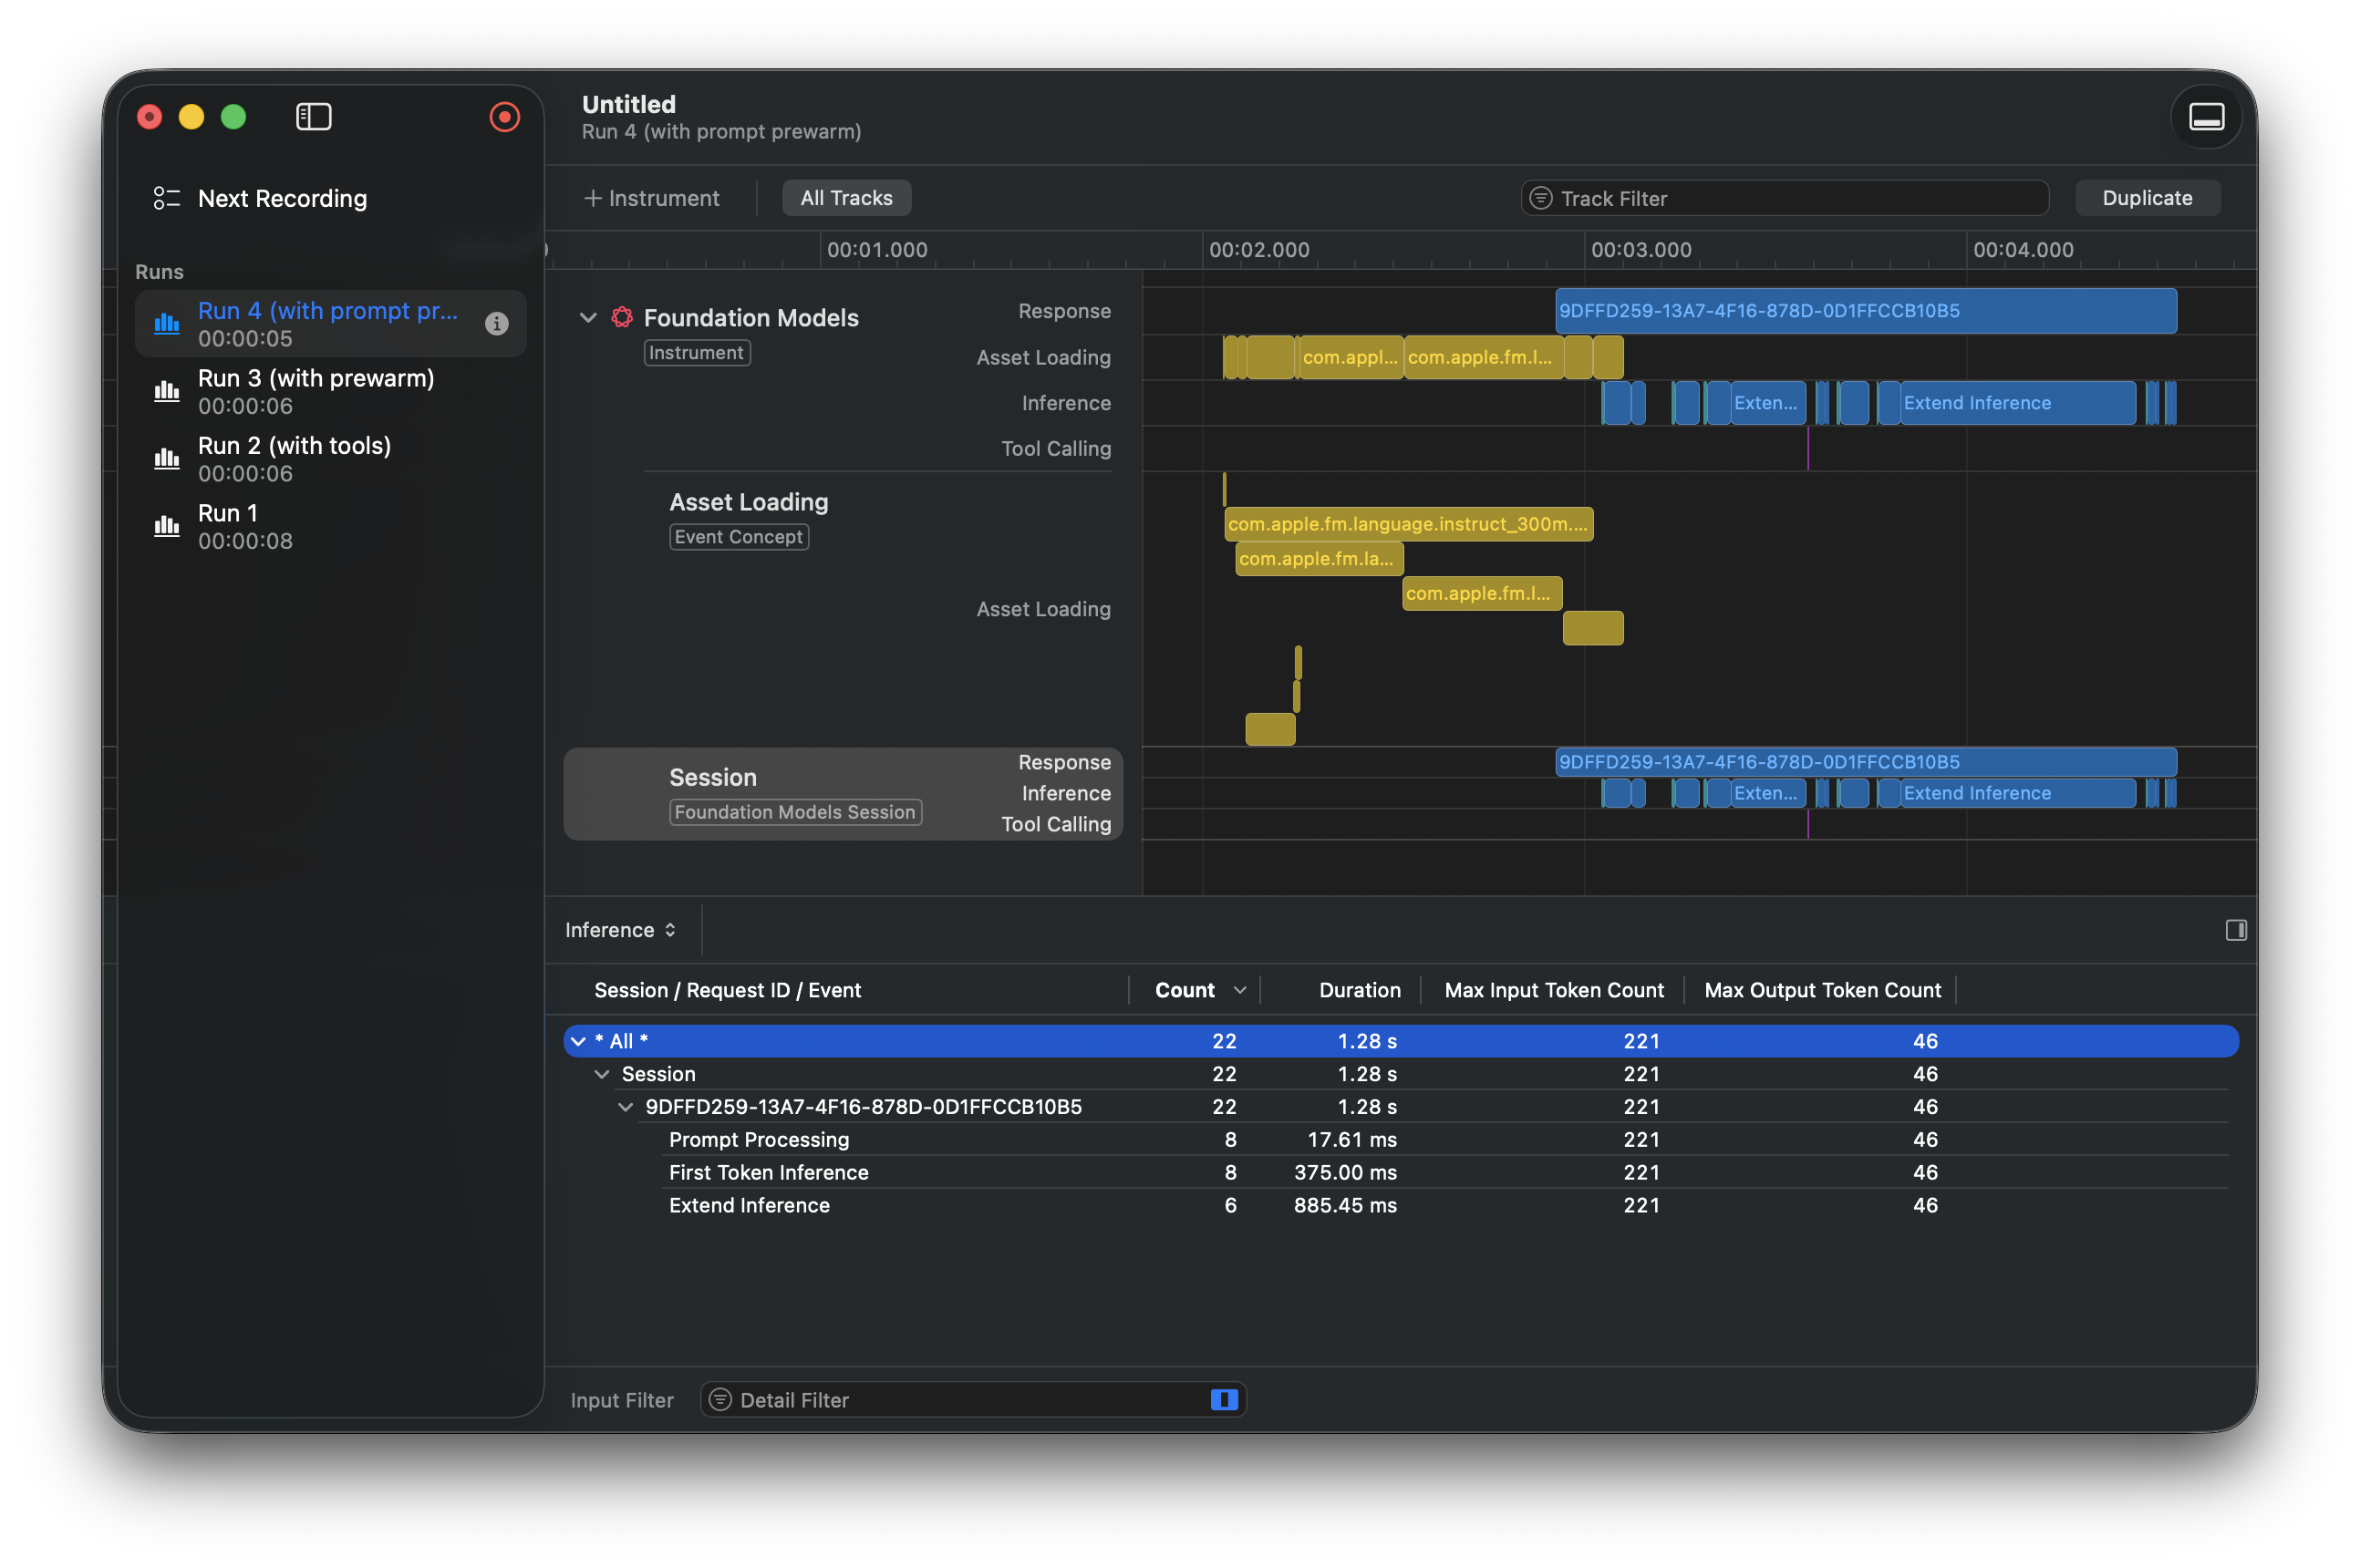
Keep in mind that prewarming doesn't guarantee immediate asset loading — especially if the app is in the background or the system is under heavy load. Also, only use prewarm if you have at least a one-second window before calling respond(to:).
Restrictions
When running the app in the iOS Simulator, you may notice that token counts always remain 0. According to Xcode 26.1 Release Notes, there is a fix related to this:
Fixed: Foundation Models Instrument shows incorrect input and output token counts. (159793146)
Unfortunately, it still not working on the simulators, so you can use it only on real devices.
Conclusion
In this post, we covered how to profile and optimize Foundation Models performance using Xcode Instruments. You may also find useful my TranscriptDebugMenu package to debug session transcripts. It allows you to search and filter transript entries, view details about transcript entries, and generate LanguageModelFeedback JSON for Apple's Feedback Assistant.
The final example is available on GitHub. Thanks for reading!

